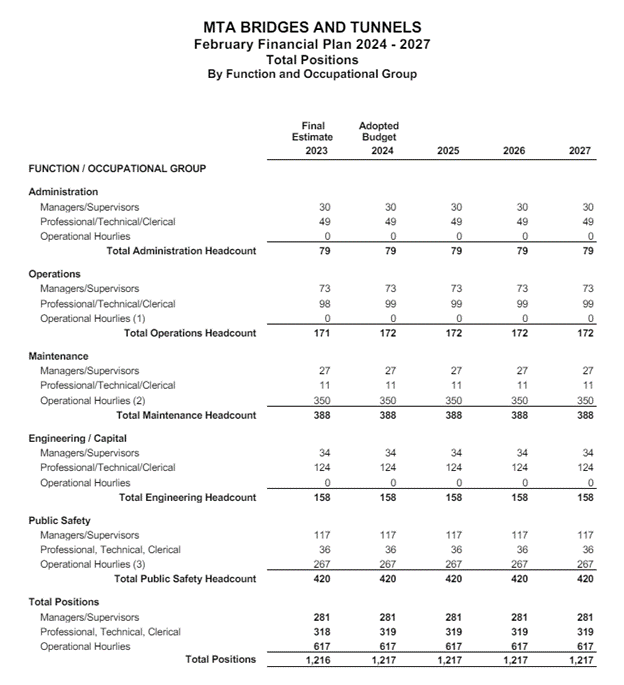
The MTA recently released three budget open datasets on Statement of Operations, Subsidies, and Headcount data reported in the MTA’s budget documents. The MTA’s Open Data Team is excited for users to explore this data and see what insights they come up with. In this blog, though, we aren’t going to talk about the datasets themselves, but the process of putting them together. Specifically, we’ll discuss the (hopefully) interesting technical challenge of turning “long” entity and account hierarchy datasets into more usable “wide” datasets.
The MTA’s budget database
Budget data at the MTA is pulled from the financial planning tool Hyperion. In Hyperion, a database called ESSBASE stores data using “on-line analytical processing” (OLAP) technology. An OLAP cube, more commonly known as a multidimensional cube, is a data structure used in data warehousing and business intelligence to store and analyze multidimensional data. It is essentially an aggregated database where stored data is pre-calculated, making it easy for users to explore and interact with large amounts of data quickly.
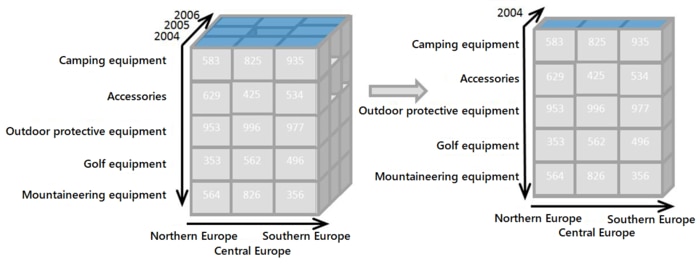
You might be asking, “I’m just interested in the budget; why do I care about OLAP?” To produce a single row in a budget table, multiple dimensions (categories) are grouped together and aggregated over the measured values (headcount or dollar value). With regards to financial data, the important questions are what was spent (accounts; think supplies, salaries) and who spent it (entity; think departments, divisions).
To access budget data in ESSBASE, we created queries to extract the underlying data. Each extract came with two corresponding metadata files: an entity hierarchy and an account hierarchy. To create open datasets that allow users to gather their own insights into the budget, we needed to develop a fundamental understanding of the hierarchical relationships between accounts and entities across the MTA, and how those map to the budget tables MTA presents to the public. This would allow us to produce datasets where each record represents each line item in the public reports, organized by subsets of financial categories.
Thus began our relationship with the MTA Headquarters Consolidated Analysis Group (CAG), the team responsible for preparing monthly actuals reports and annual financial plans. Their extensive knowledge covers individual MTA agency budgets, downstream Hyperion data pipelines, dimension hierarchies, financial and legal consolidation requirements, and more. Over the course of several months, we worked closely to develop a common language of interpreting the budget data and pieced together the business logic applied to the consolidated reporting system.
These conversations naturally evolved to include the database administrator of ESSBASE, who provided the systems approach for how and when to pull the budget data. Our next step was to incorporate the consolidation requirements into our extract, using the hierarchies to inform their structure. The account and entity dimensions in ESSBASE contain multiple trees for the same lowest-level account or entity, allowing for different ways of reporting the same underlying data (think internal operations reports versus external board material reports). The challenge of having different ways to represent the same budget data is finding the right subset of dimensions for the open datasets.
Multidimensional data hierarchies
In a multidimensional database, every dimension represents a subsection of the database tree. Within each tree, “generations” and “levels” represent the distance from either the “root” (viewed from the top down) or “leaves” (viewed from the bottom up) of the dimension. This position reference allows for locating any member within a database tree and, more broadly, an understanding of the relationships between groups of related members. Some of these hierarchies can be quite deep, as far as 15 entities or accounts from root to leaf.
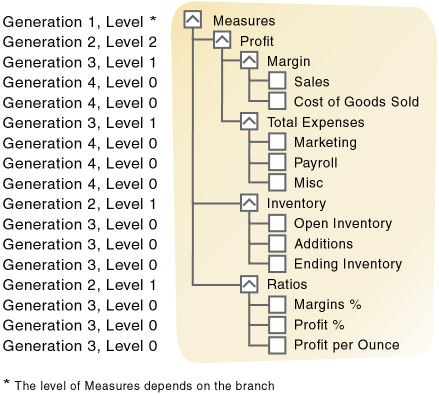
To determine where accounts and entities in the budget extract fell in MTA’s hierarchy, we needed to join the metadata files to the extract. However, the original metadata files did not make these hierarchies obvious. Instead, the metadata files had three columns—child, parent, and child_description—and rows for all entities and accounts.

Alone, these files weren’t that useful:
- They don’t obviously communicate what level of the hierarchy an entity or account occupies. Is an entity the lowest level in a hierarchy (think NYCTA A Division Transport Operations)? Somewhere in the middle of the hierarchy (think NYCTA Service Delivery)? Or at the top of a hierarchy (think NYCT, or MTA Consolidated)?
- They don’t tell you how deep the hierarchy is, or what distinct hierarchies are represented in the metadata file. The same
childaccount can repeat multiple times in the metadata file, with differentparents, and appear as a parent for other accounts. This makes sense for representing accounts or entities in different ways, but it makes interpreting the metadata files confusing; if we see two rows with achildof Farebox Revenue, one with aparentof Operating Revenue, and one with aparentof Uncontrollable Revenue, it’s hard to make sense of what function each serves without knowing the rest of the hierarchy. - They don’t provide you an easy way to understand the account or entity’s parent, just the code or number associated with it. Knowing entity “A Division Transport Operations” has a
parentof “NYCTA_2398” isn’t that helpful unless you’re already pretty knowledgeable about the MTA.
Unfolding entity/account trees
To create a more useful entity and account hierarchy, we needed to unfold the metadata files so that each row represented one complete hierarchy for a lowest-level account or entity, with columns for each level of the hierarchy. We did this using a function we made (with some help from a Medium blog post) using Python’s polars library called unfold_trees.
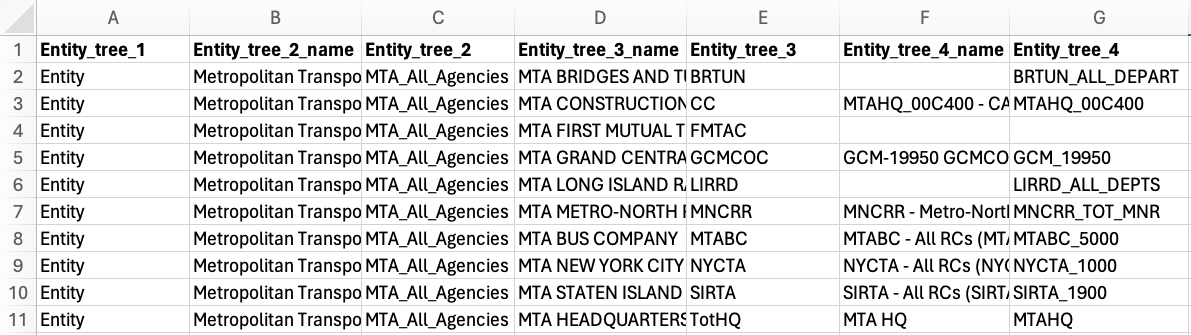
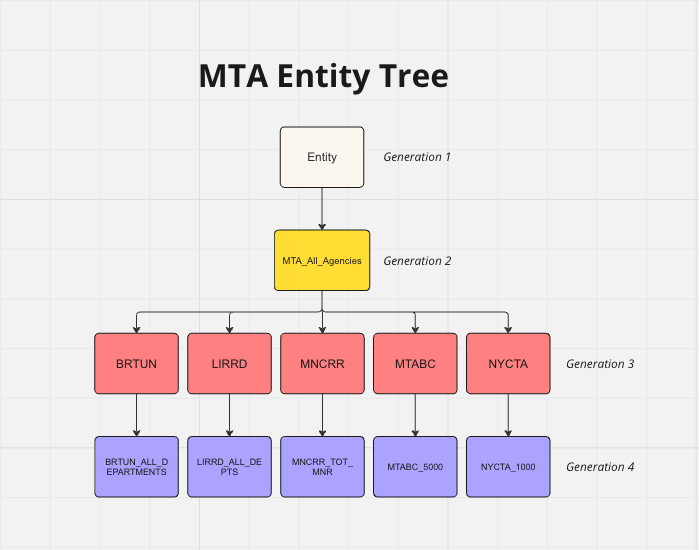
unfold_trees function to the entity metadata dataset. The tree root is the first column, and lower-level entities fill subsequent columns
This process proceeds in a few steps:
- The function filters the original metadata dataset to all rows where a
parentaccount/entity never appears as achild(to unfold from the bottom up, you could do the reverse instead). This represents the top-level of a hierarchy for each account/entity in the data (our unfolding dataset), and we subset the dataset to the parent column renamed as[account or entity]_tree_1. - This next part starts incrementally unfolding the hierarchy to subsequent generations from the top-down, and we repeat it until we’ve reached the lowest-level child entity (the leaf).
- We left-join the original dataset back to our unfolding dataset, using the
[account or entity]_tree_1column in the unfolding dataset and theparentcolumn in the original dataset. - We keep the columns in the unfolding dataset, but rename the joined
childandchild_descriptioncolumns as the next level in the hierarchy; for the first join,[account or entity]_tree_2, and for subsequent joinsaccount_or_entity_tree_[n+1], wherenrepresents each iteration. - As part of each iteration, we check whether all
account_or_entity_tree_[n+1]s areNull;essentially, whether there any generations left to unfold. If there aren’t, we stop iterating, and are left with a dataset showing from left to right the top level of each hierarchy to the bottom (in our example earlier, from “MTA Consolidated” inentity_tree_1to “A Division Transport Operations” inentity_tree_8).
- We left-join the original dataset back to our unfolding dataset, using the
- Once we’ve fully unfolded the hierarchy, we look back through each row to find the lowest-level account/entity, and add that as a column to the end of the data as
[account or entity]_child. Each hierarchy can be of different lengths, so it’s convenient to have information on the lowest-level account/entity in one place.
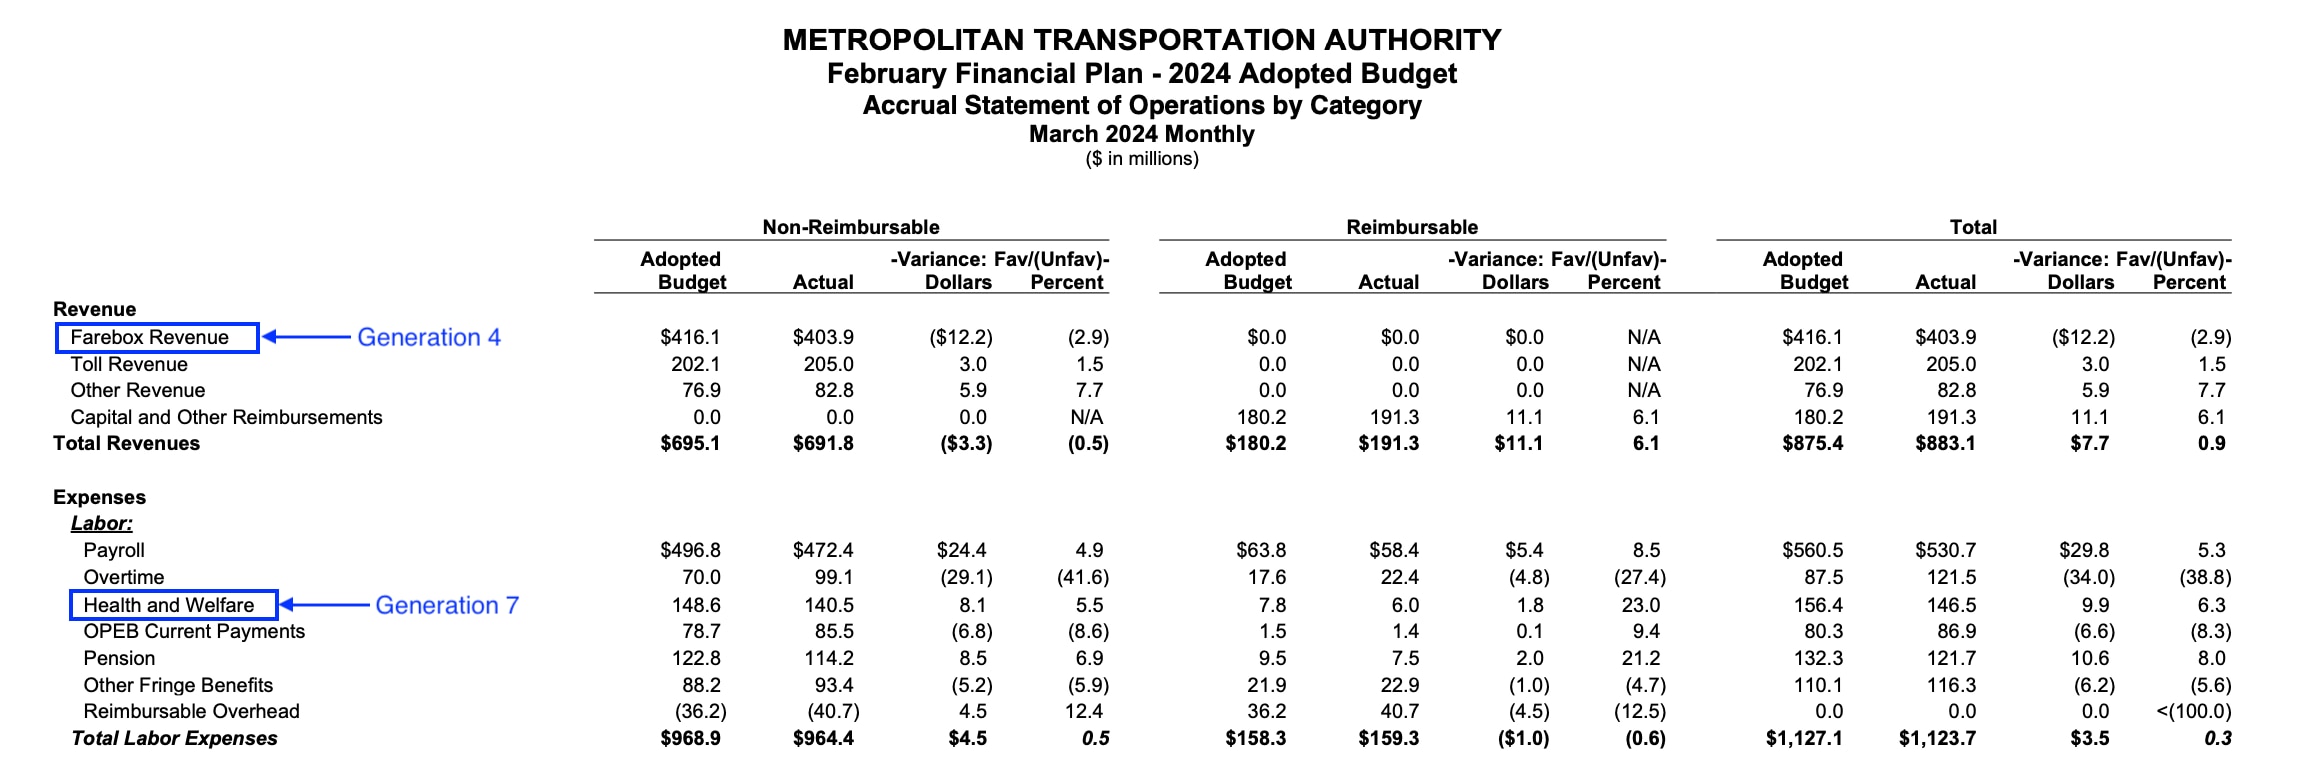
This doesn’t resolve all the challenges of working with the budget data. Each row tells us where entities/accounts fall in a hierarchy of other accounts/entities in the same row, but not where accounts/entities fall in relation to accounts/entities in other rows. So Farebox Revenue appears at account_tree_4 for one account, and Health and Welfare at account_tree_7 for another account, even though they exist at similar conceptual levels in the Consolidated Statement of Operations.
Lowest-level accounts can also repeat with different hierarchies (e.g., representing Farebox Revenue as Operating or Uncontrollable Revenue). And different queries produce different metadata files; an early, incomplete version of the query produced a discontinuous hierarchy, where entities appeared at levels of the hierarchy they shouldn't have.
But unfolding the entity and account files made it much easier to know 1) what accounts/entities are the lowest level in the data, and 2) where they existed in the account/entity hierarchy, an important starting point for creating an open budget dataset.
Conclusion
This was a just small part of a long and involved project, but we hope a helpful illustration of some of the complexities of working with multidimensional data. And we hope you enjoy exploring the fruits of this project on the NY State Open Data portal—MTA’s Statement of Operations, Subsidies, and Headcount budget datasets.
About the authors
Niki Keramat and Dan Powers are Senior Data Scientists on the Data & Analytics team.